

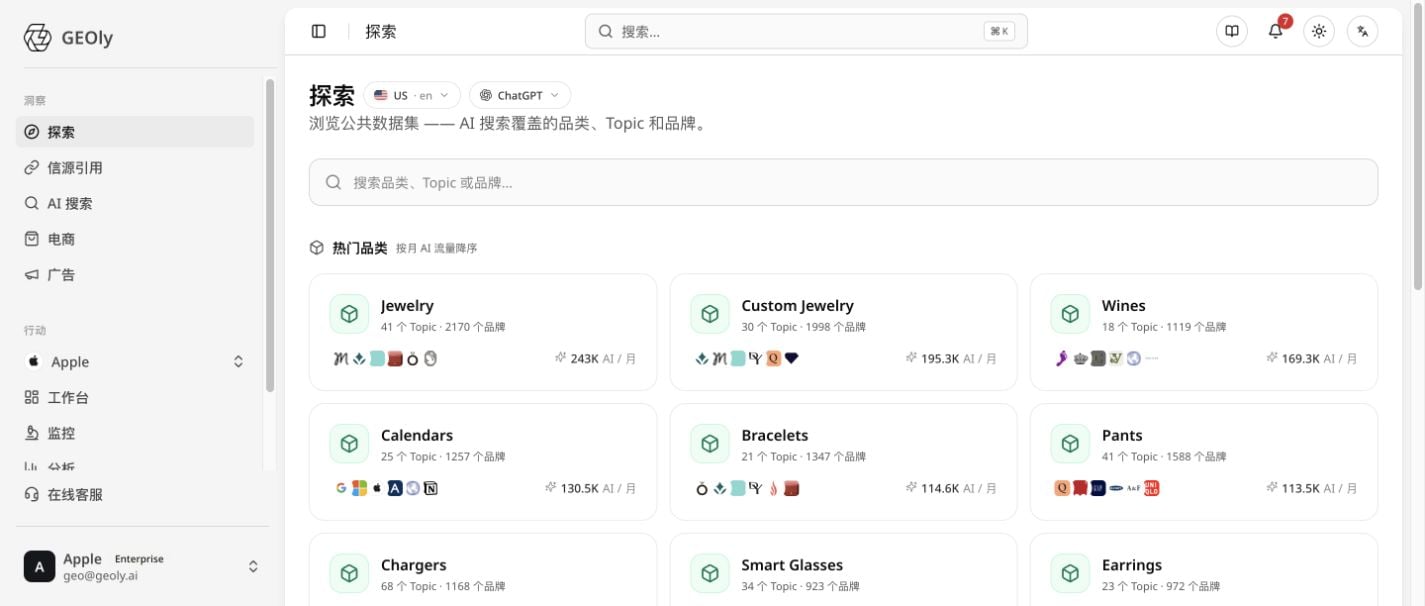
What Explore is for
Explore helps growth, content, and research teams answer questions such as:- Which categories and user questions are active in AI discovery?
- Which brands are repeatedly recommended or compared?
- What sources does AI rely on when it explains a category?
- Where could a brand earn more coverage, evidence, or product visibility?
Before you start: lock the scope
Every result is tied to a specific research scope. Record these choices before comparing anything:- Market and language: category behavior and source patterns can change by country and language.
- AI platform: compare only platforms included in the current dataset.
- Object and date range: decide whether you are researching a category, Topic, or brand, and keep the time window consistent.
Start with the Explore homepage
The homepage is designed for discovery. Browse a category, search for a public entity, or open a popular Topic.Categories
Category cards can include Topic counts, brand counts, and estimated AI traffic per month. These are prioritization signals for public research—not market size, web sessions, orders, or revenue. Choose a category when it is relevant to your audience, contains enough Topics to investigate, and has enough observations to support a useful comparison.Topics
A Topic represents a recurring question or need in a category. Topics are useful for moving from a broad market view to the specific language and situations that appear in AI answers.Brands
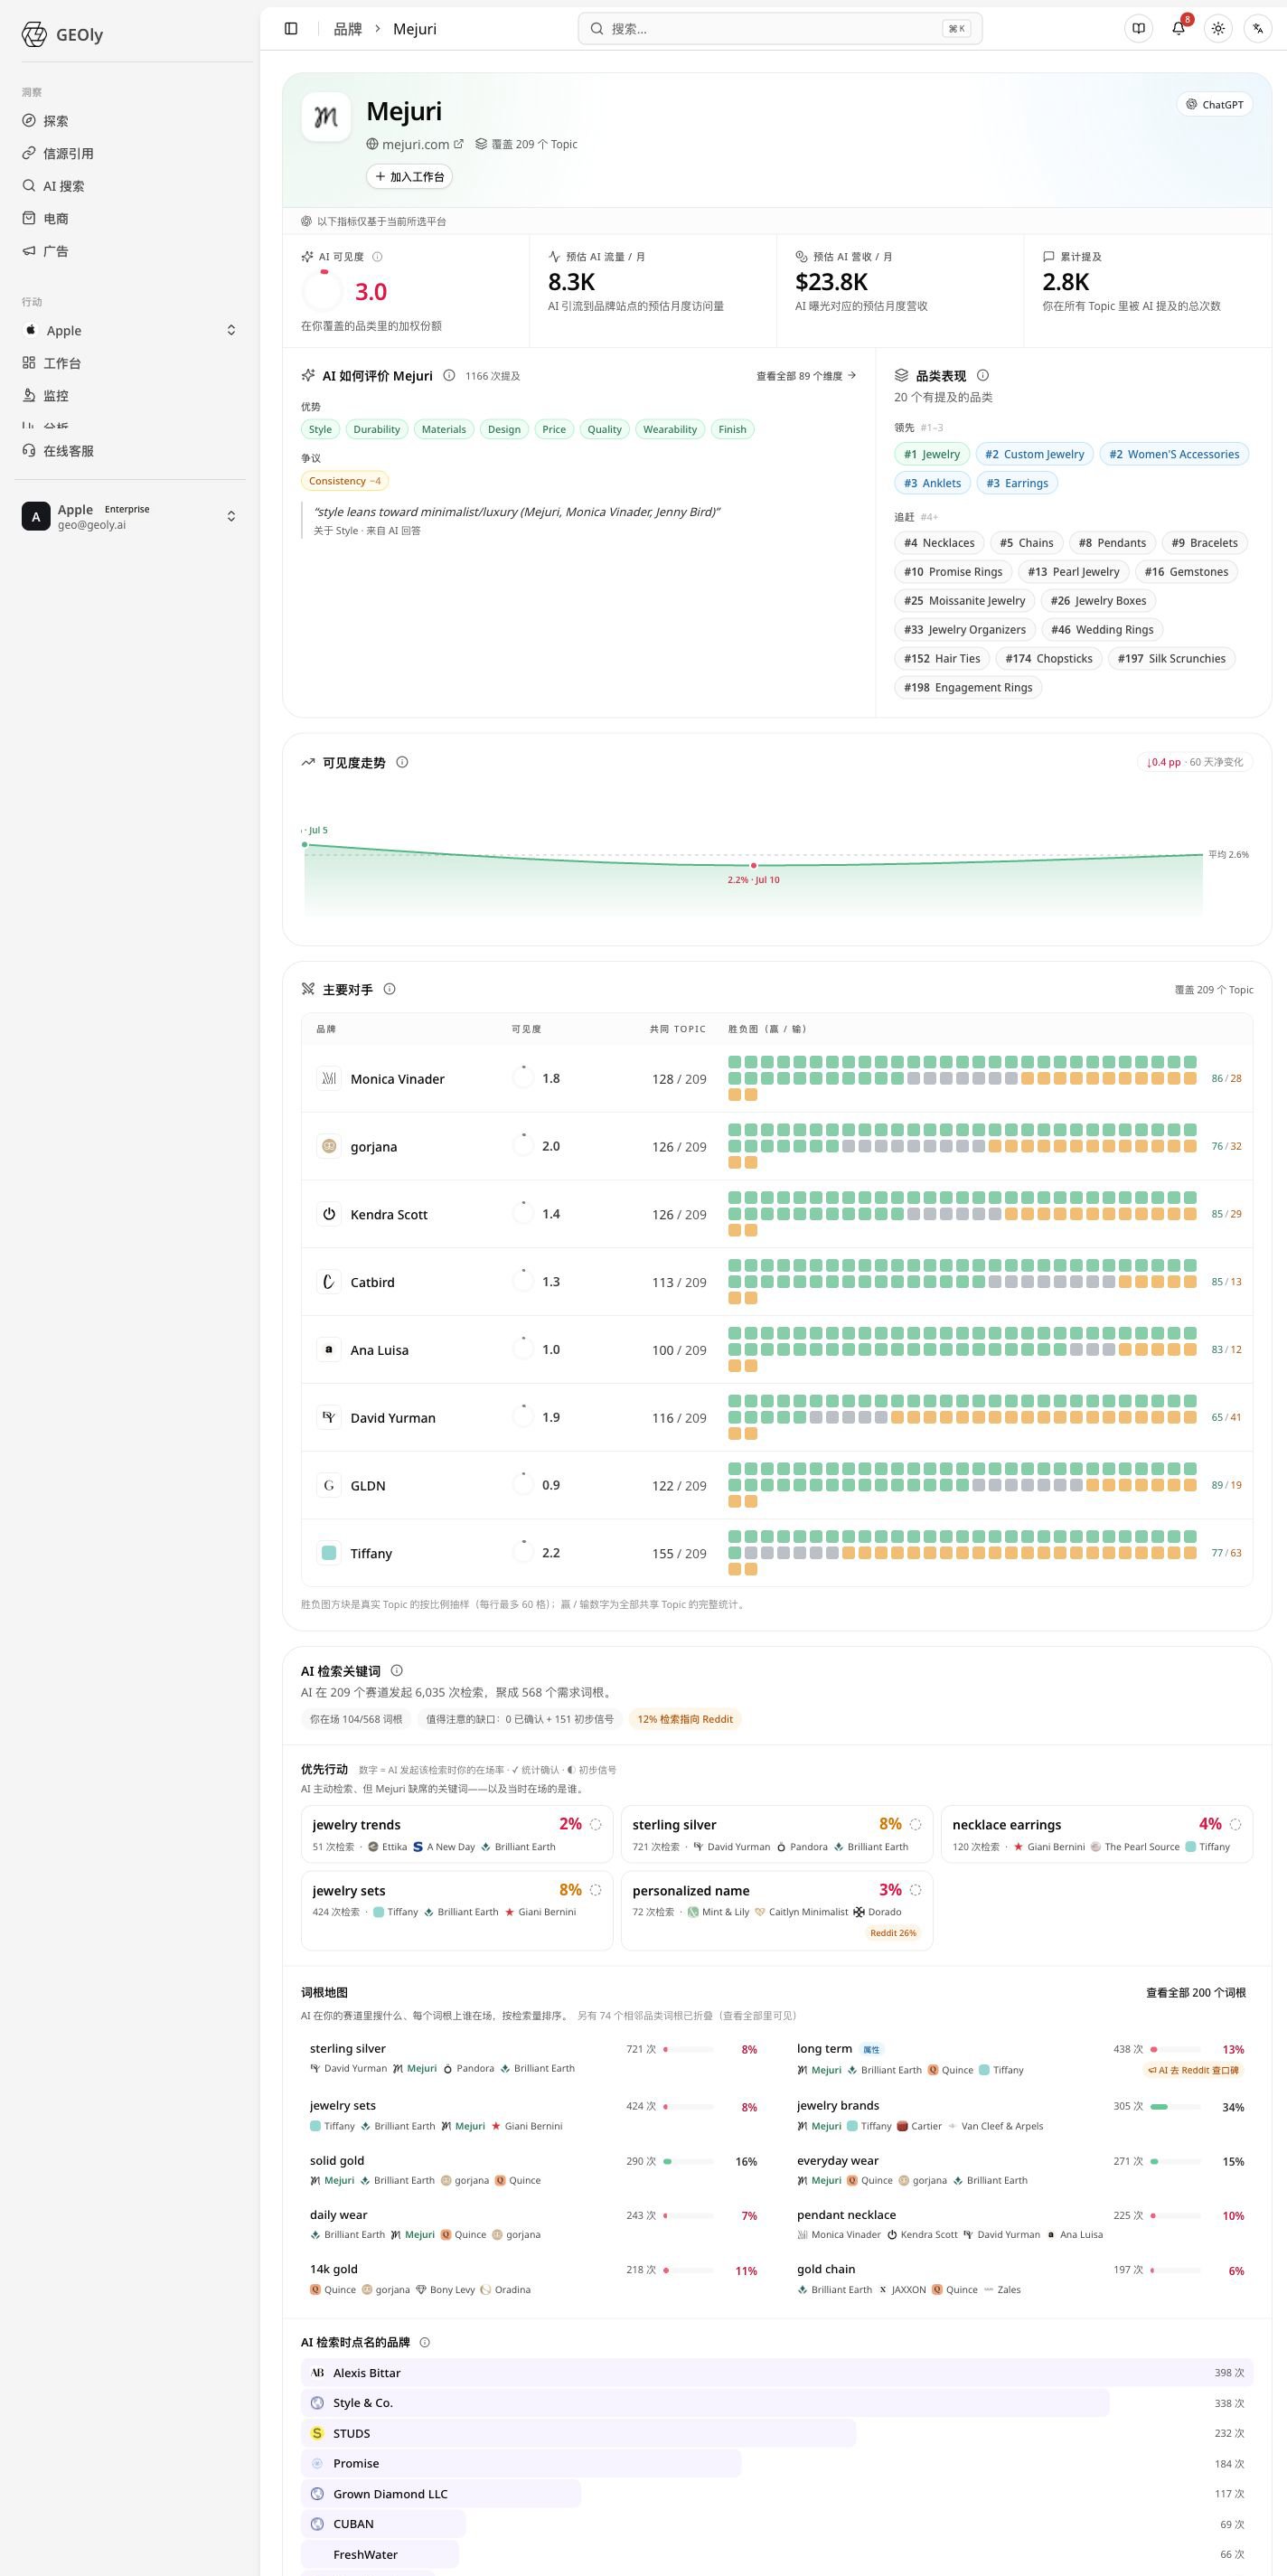
A public brand page shows how AI positions a brand across the available category and Topic data. Use it to find recurring associations, competing brands, and areas where the brand appears—or does not appear—in the current sample.Read a category like a researcher
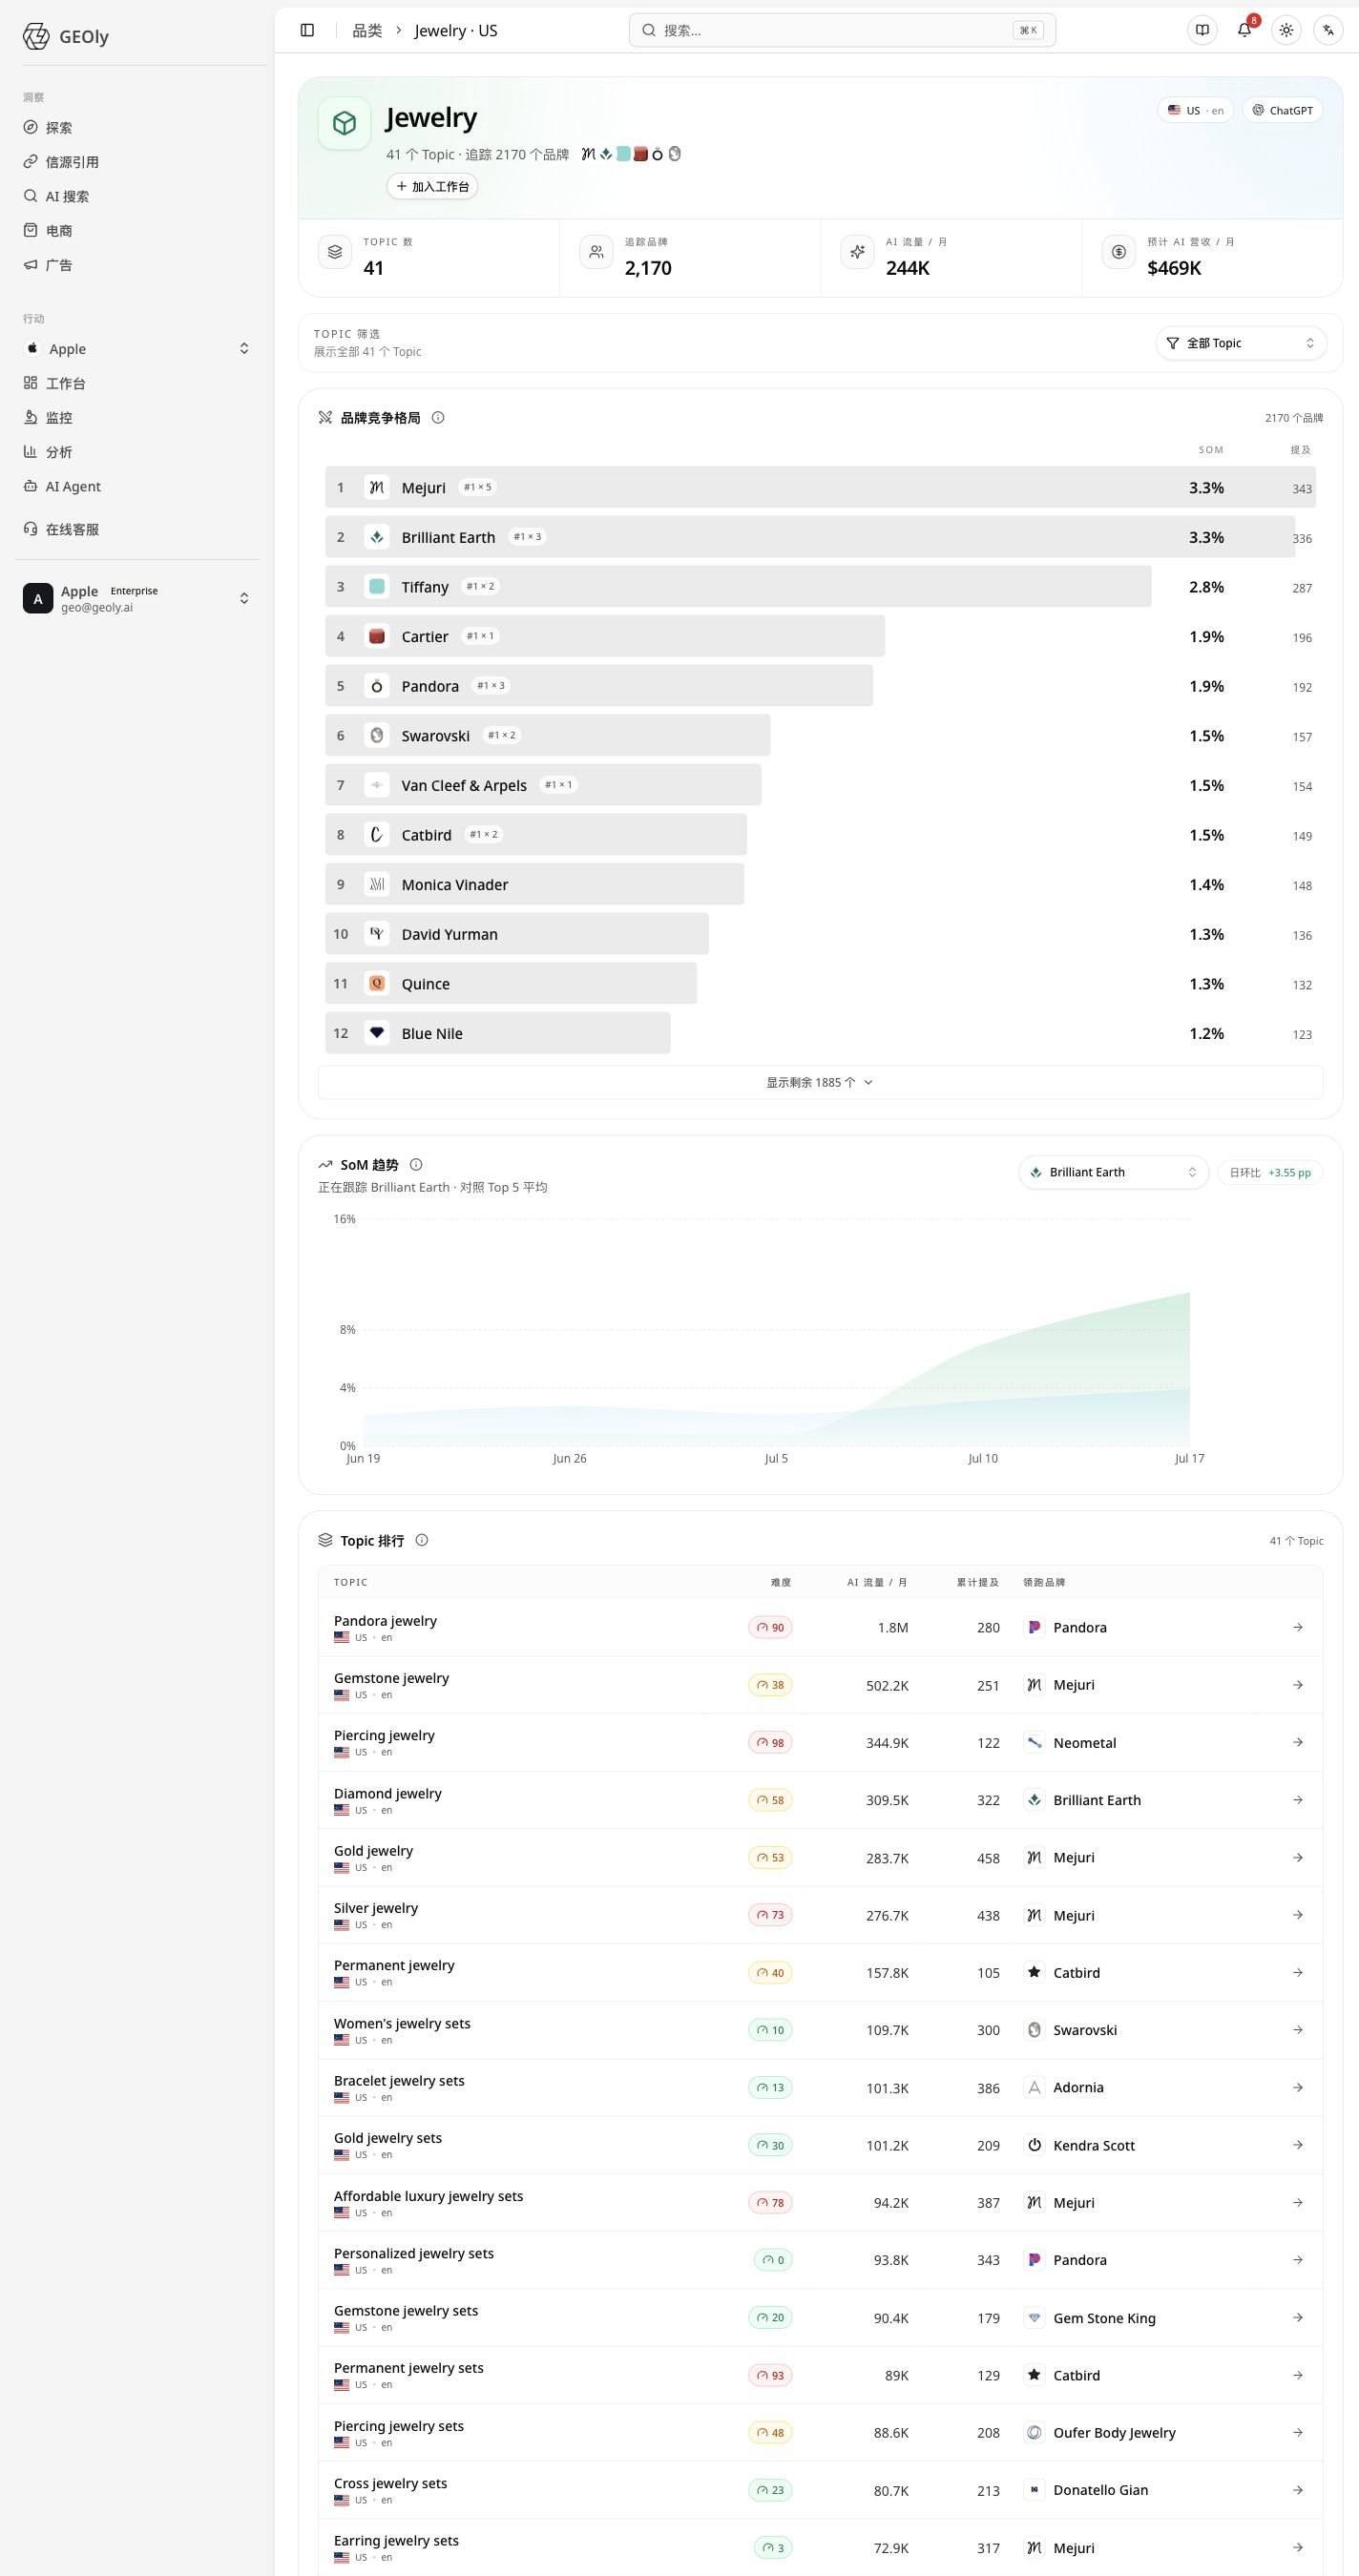
When you open a category, use this sequence:- Check the overview to understand coverage and the selected scope.
- Scan the brand leaderboard and SoM to see relative public presence.
- Review the trend only after confirming that the comparison window and platform are consistent.
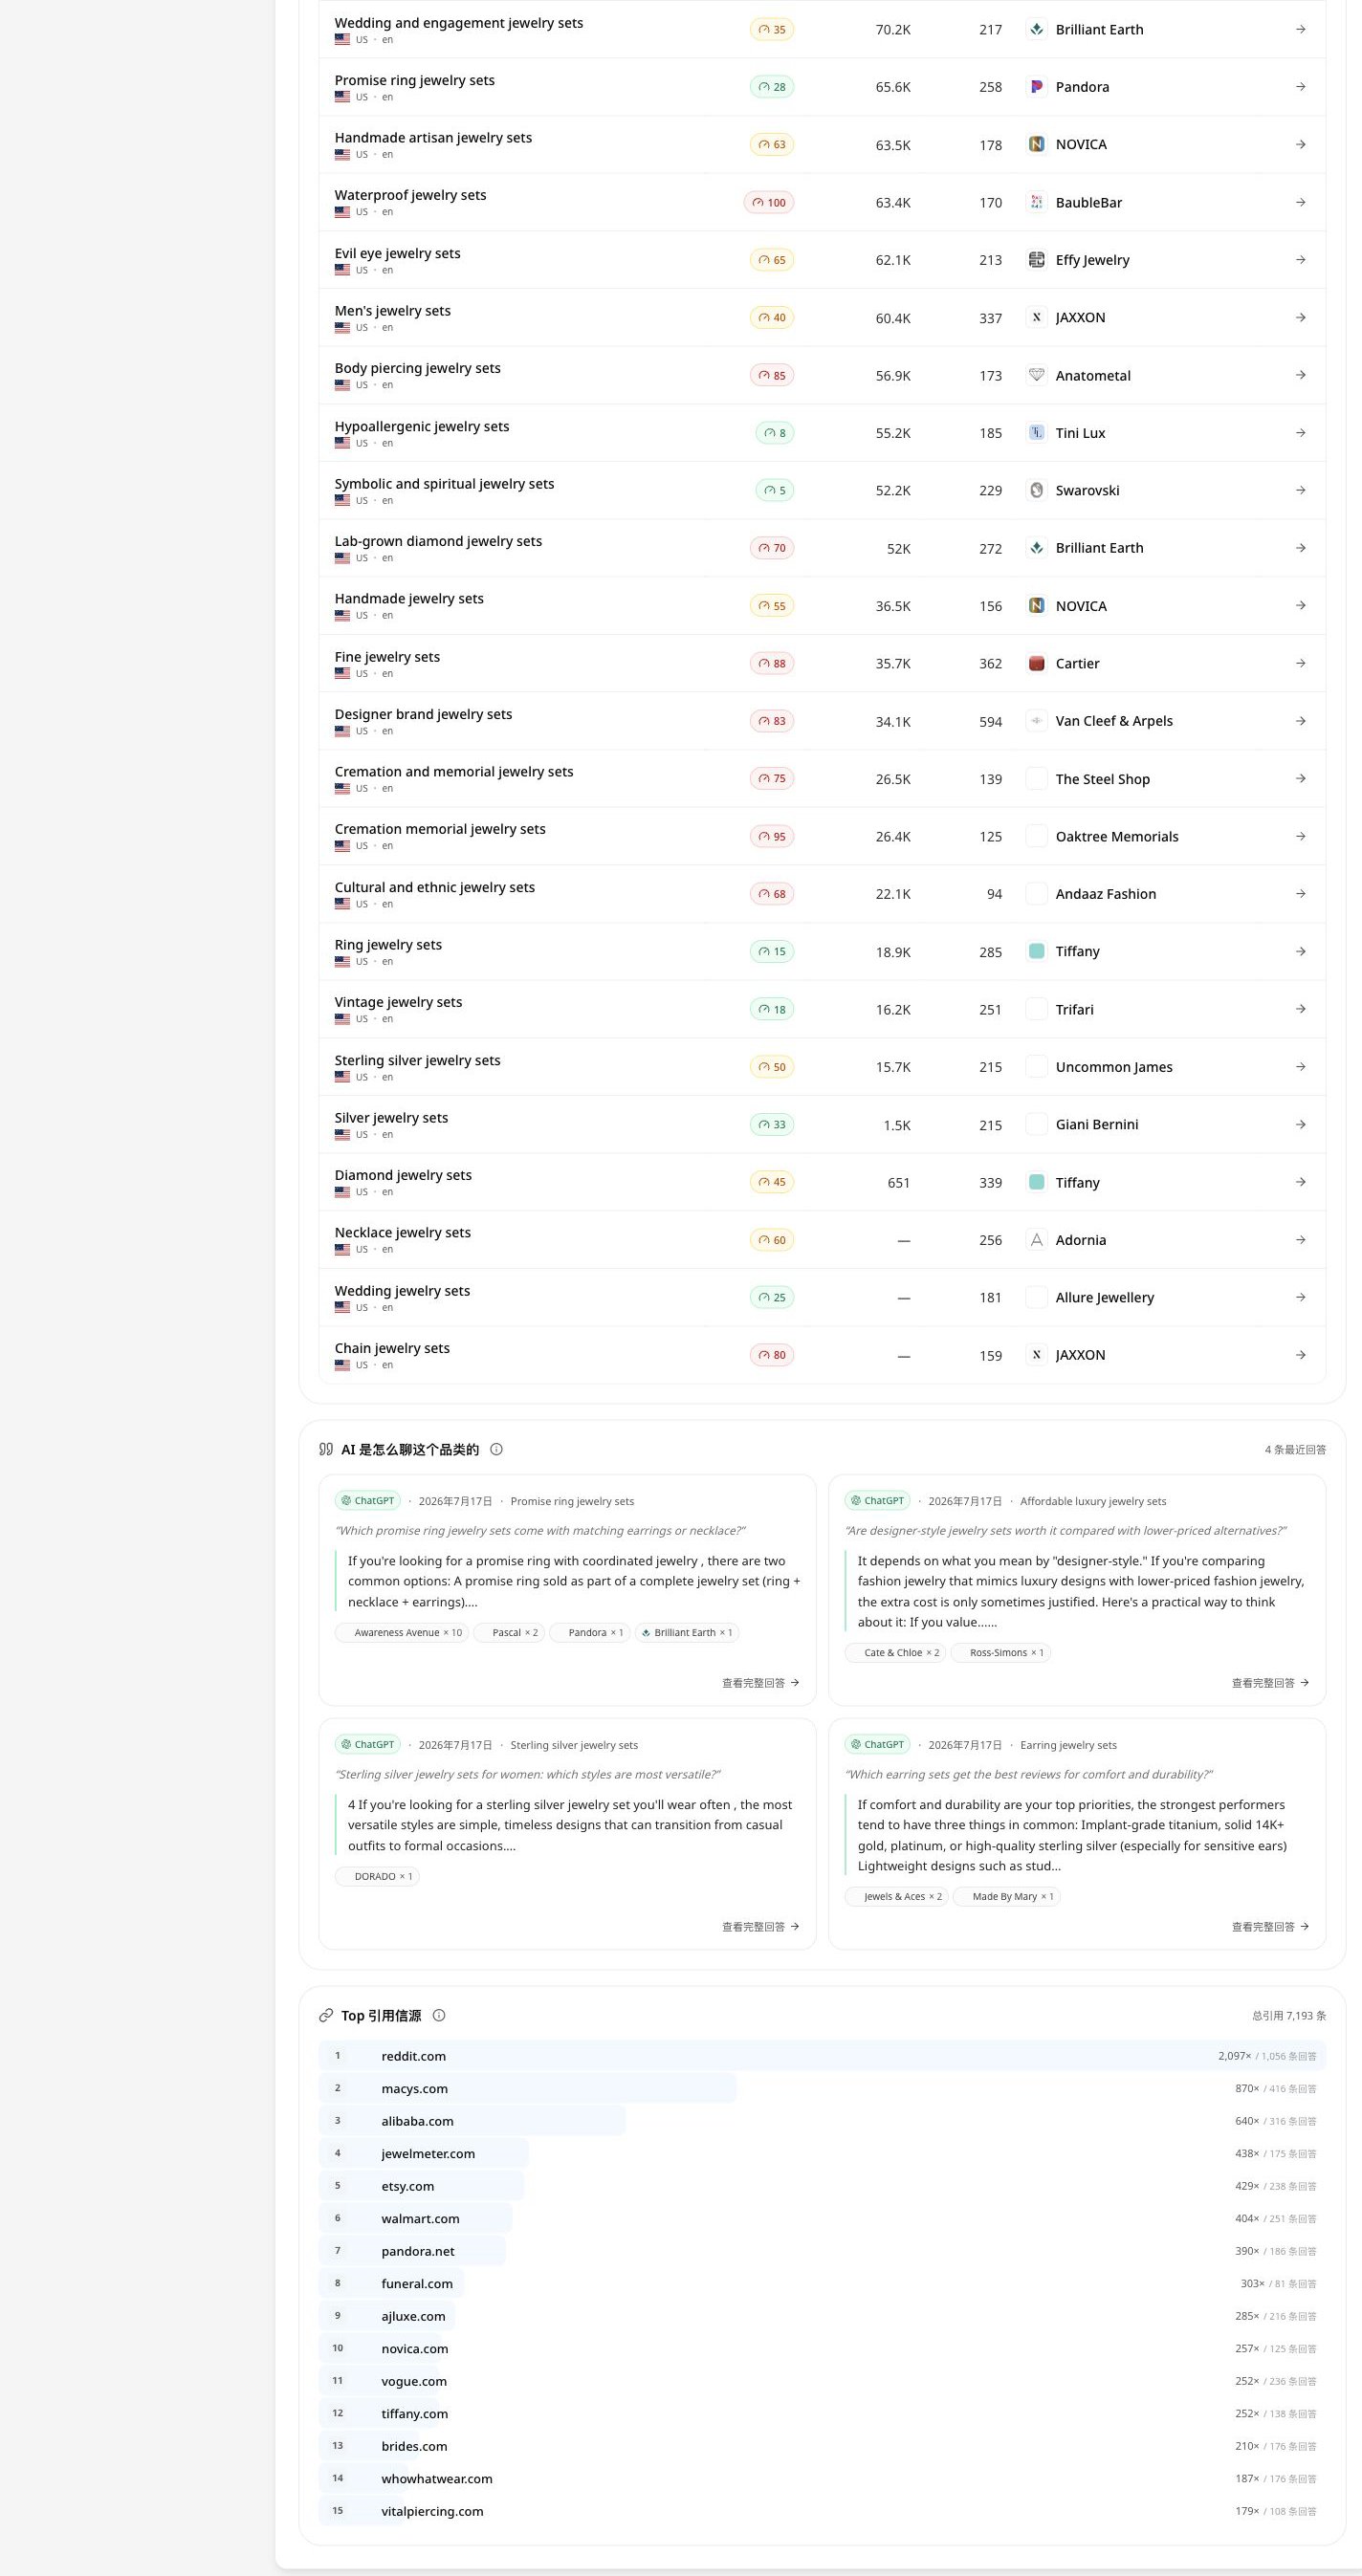
- Open the Topic ranking to find questions that matter to your business.
- Inspect citations and recent mentions to see which sources and answer contexts influence the result.
How to read SoM
SoM (Share of Mention) is a relative measure inside the selected public category scope. It is not total market share, sales share, traffic share, or your monitored AIGVR or Mention Rate.Use brand pages to understand AI positioning
A brand page is most useful when you want to understand the language AI uses around a brand:- Which Topics and use cases bring the brand into answers?
- Which attributes or audiences appear repeatedly?
- Is visibility broad or concentrated in a small number of Topics?
- Which brands share the same answer contexts?
Turn a Topic into a research brief
For each Topic, assess:- business relevance;
- demand and sample size;
- brand concentration;
- recurring competitors;
- frequently cited domains; and
- the answer context behind recent mentions.
A practical Explore workflow
- Pick a category or search term that matches your business.
- Set the market, language, platform, and date range.
- Shortlist Topics using relevance, demand, difficulty, and sample quality.
- Compare leading brands and note repeated positioning language.
- Open citations and recent mentions to collect evidence and context.
- Write one testable hypothesis—for example, a comparison page, product detail improvement, or third-party evidence project.
- Validate the hypothesis in Monitoring or Analysis using your own brand’s data.
How the supporting Insights views fit
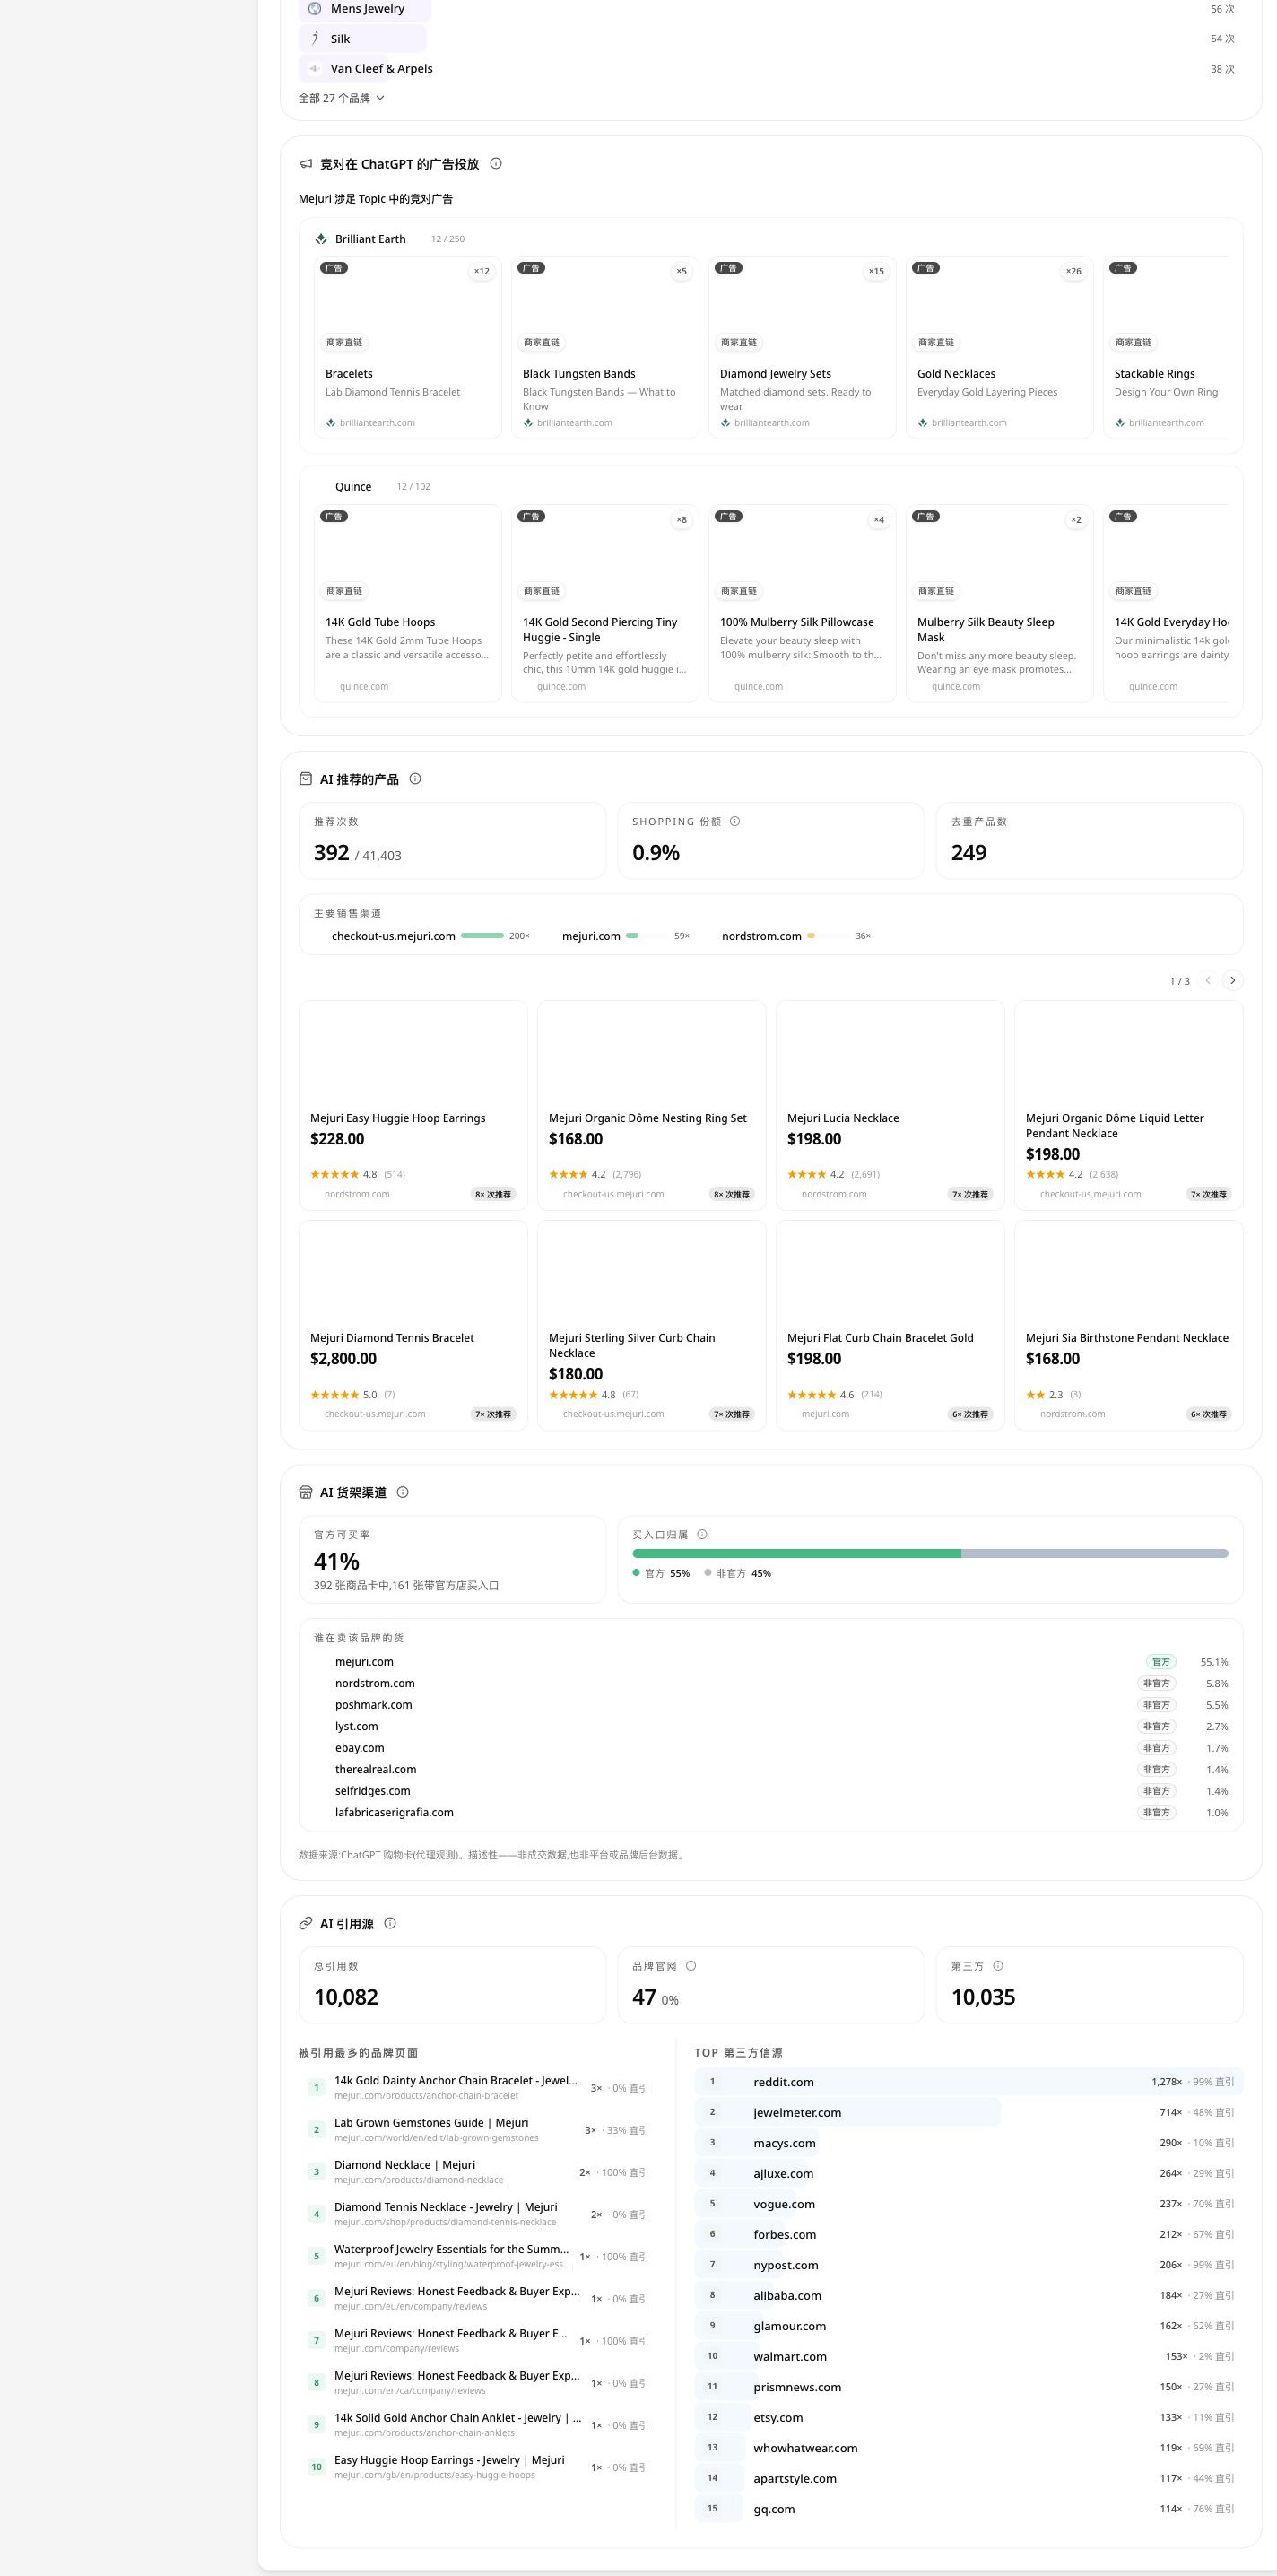
Explore is the discovery layer. Continue the investigation in the view that answers the next question:- AI Search: break down user questions and Query FanOut.
- Citations: identify source types, domains, positions, and Topic coverage.
- Shopping: understand products, prices, retailers, and AI shelf visibility.
- Ads: inspect competitive paid exposure surfaces.
Reading the main signals
AI traffic per month and estimated AI revenue
These are directional public-data estimates. They are not a brand’s analytics, order volume, advertising return, or finance data.Trends and brand momentum
A trend can show a change in relative public position across comparable periods. Empty dates may mean that no comparable observations were available. Always check the Topics and recent mentions behind a movement.Citations and recent mentions
Citation counts and positions describe how sources appear in the current AI-answer sample. They do not prove that a cited domain is authoritative, that it drove referral traffic, or that it equals your monitored Citation Rate.AI perception
AI perception groups recurring attributes and evidence statements. Use it to generate questions for content and positioning work, then verify the underlying answers. It is not a substitute for customer research or sentiment surveys.Topic whitespace
Whitespace highlights Topics where competitors appear more often than the target brand. Before acting, confirm the Topic fits the business, understand why competitors are present, and check that the sample is stable enough to support a hypothesis.Common mistakes
- Treating public AI estimates as first-party business metrics.
- Comparing markets, languages, platforms, or periods without matching the scope.
- Treating public citation data as your own Citation Rate.
- Reading a brand mention or product card as proof of an ad, click, sale, or causal effect.
- Concluding that a brand is absent when the result may reflect coverage, access, date range, or data availability.